Use Graph To Investigate Limit

In summary, the conversation was about using a graph to investigate the limit of a function as x approaches 0. The given function was expressed as f(x) = |x| and the limit was found to be positive infinity from both the left and right. The limit was questioned due to the appearance of the graph, but it was clarified that the limit is indeed 0. Another example was provided with a different function, y = -|x|, and it was shown that the limit is still 0. The purpose of investigating the limit as x approaches 0 was emphasized, and the conversation ended with a discussion about a previous member who had caused issues for the other members.
  • #1
nycmathguy
Summary:: Use Graph To Investigate Limit

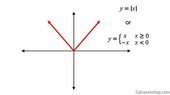
Use the graph to investigate the limit of f(x)
as x tends to 0.

Let me see.

I got to use the graph to investigate the limit of f(x) as x tends to 0 from the left and right.

Let y = f(x).

The given function can also be expressed as f(x) = | x |.

The limit of (-x) as x-->0 from the left is positive infinity.

The limit of (x) as x-->0 from the right is positive infinity.

The limit of f(x) as x-->0 from the left and right at the same time is positive infinity.

Can I say the limit of f(x) is positive infinity?
 

Attachments

  • th.jpeg-5.jpg
    th.jpeg-5.jpg
    5.8 KB · Views: 84
Last edited by a moderator:
Physics news on Phys.org
  • #2
nycmathguy said:
The limit of (-x) as x-->0 from the left is positive infinity.

The limit of (x) as x-->0 from the right is positive infinity.

The limit of f(x) as x-->0 from the left and right at the same time is positive infinity.

Can I say the limit of f(x) is positive infinity?
Only if you think for some unfathomable reason that zero and positive infinity are the same thing.

You CLEARLY show a graph in which the y value goes to zero as the x value approaches zero. How can you think that this is positive infinity?
 
  • #3
phinds said:
You CLEARLY show a graph in which the y value goes to zero as the x value approaches zero. How can you think that this is positive infinity?
+1
 
  • #4
phinds said:
Only if you think for some unfathomable reason that zero and positive infinity are the same thing.

You CLEARLY show a graph in which the y value goes to zero as the x value approaches zero. How can you think that this is positive infinity?

I was thinking about the V shape formed by the graph of y = | x |. In quadrants 1 and 2, the graph starts at (0, 0) and shoots upward through quadrants 1 and 2 into eternity. However, thinking about it, as I walk toward zero on the x-axis from the left and right, the graph does reach a height of zero. The limit is 0.
 
  • #5
Mark44 said:
+1

What does +1 mean? Please, read my reply to phinds.
 
  • #6
nycmathguy said:
What does +1 mean? Please, read my reply to phinds.
+1 means I agree with what phinds wrote.
nycmathguy said:
I was thinking about the V shape formed by the graph of y = | x |. In quadrants 1 and 2, the graph starts at (0, 0) and shoots upward through quadrants 1 and 2 into eternity. However, thinking about it, as I walk toward zero on the x-axis from the left and right, the graph does reach a height of zero. The limit is 0.
Since the problem was to find the limit as x approaches zero, it's immaterial what the graph does for large x or for very negative x.
 
  • #7
Mark44 said:
+1 means I agree with what phinds wrote.
Since the problem was to find the limit as x approaches zero, it's immaterial what the graph does for large x or for very negative x.
What about if the graph is y = -| x | as x tends to 0? You said: "...it's immaterial what the graph does for large x or for very negative x." Can you provide an example using another function?

By the way, are you the same MarkFL from Florida? He is very popular in other math forums.
 
  • #8
nycmathguy said:
What about if the graph is y = -| x | as x tends to 0? You said: "...it's immaterial what the graph does for large x or for very negative x." Can you provide an example using another function?
Do you have some belief that -0 is different from +0 ?

By the way, are you the same MarkFL from Florida? He is very popular in other math forums.
click on his avatar to see that he is from Washington State
 
  • #9
nycmathguy said:
What about if the graph is y = -| x | as x tends to 0?
Same limit value.
$$\lim_{x \to 0} |x| = \lim_{x \to 0} -|x| = \lim_{x \to 0} x^2 = \lim_{x \to 0} x^3 = 0$$
nycmathguy said:
You said: "...it's immaterial what the graph does for large x or for very negative x." Can you provide an example using another function?
If you're investigating the limit of some function as x approaches zero, why would you want to check on what happens if x is very large or very negative? That's what I meant by "it's immaterial".
 
  • Like
Likes nycmathguy
  • #10
Mark44 said:
Same limit value.
$$\lim_{x \to 0} |x| = \lim_{x \to 0} -|x| = \lim_{x \to 0} x^2 = \lim_{x \to 0} x^3 = 0$$
If you're investigating the limit of some function as x approaches zero, why would you want to check on what happens if x is very large or very negative? That's what I meant by "it's immaterial".

I get it now thanks to you. This is a great site.
 
  • #11
phinds said:
Do you have some belief that -0 is different from +0 ?

click on his avatar to see that he is from Washington State

No. Obviously, -0 = +0 = no value. Yes, you are right. He is not MarkFL. I do miss MarkFL. What an incredible mathematician he truly is. Member jonah ruined my friendship with MarkFL. Sorry but I needed to bring this into light.
 

1. What is a limit in a graph?

A limit in a graph refers to the value that a function approaches as the input (x-value) gets closer and closer to a certain value. It is denoted by the notation lim f(x) as x approaches a, where a is the value the function is approaching.

2. How do you use a graph to investigate a limit?

To investigate a limit using a graph, you can plot the function and observe the behavior of the graph as the input values get closer to the desired value. You can also use the limit definition to calculate the limit algebraically and compare it to the graph.

3. What does a limit tell us about a function?

A limit tells us about the behavior of a function at a specific point. It can help determine if the function is continuous at that point, if there is a vertical asymptote, or if the function approaches a certain value as the input values get closer to a specific value.

4. How can a graph help determine if a limit exists?

If a function is continuous at a specific point, then the limit at that point exists and is equal to the value of the function at that point. A graph can help determine if a function is continuous by looking for any breaks or jumps in the graph at that point.

5. Can a graph show all possible limits of a function?

No, a graph can only show the behavior of a function at a specific point. To determine all possible limits of a function, you would need to use the limit definition and algebraic methods to evaluate the limit at different points.

Similar threads

  • Calculus and Beyond Homework Help
Replies
6
Views
891
  • Calculus and Beyond Homework Help
Replies
7
Views
834
  • Calculus and Beyond Homework Help
Replies
3
Views
733
  • Calculus and Beyond Homework Help
Replies
2
Views
697
  • Calculus and Beyond Homework Help
Replies
15
Views
1K
  • Calculus and Beyond Homework Help
Replies
2
Views
754
  • Calculus and Beyond Homework Help
Replies
6
Views
769
  • Calculus and Beyond Homework Help
Replies
20
Views
1K
  • Calculus and Beyond Homework Help
Replies
11
Views
740
  • Calculus and Beyond Homework Help
Replies
12
Views
787
Back
Top