Investigating Reading Comp. w/ Cultural Capital: A T-Test

In summary: Worried)We have that $\frac{1}{0.84218}\approx 1.19$... (Worried)So, the degrees of freedom would be $3137$. (Correct)
  • #1
mathmari
Gold Member
MHB
5,049
7
Hey! :eek:

The international comparative school performance study PIRLS (Progress in International Reading
Literacy Study) raised in 2011 the reading competences of the fourth graders in more than 40 countries, mong others in Germany.
They would now like to investigate how the cultural capital of the parents affects the reading competencies of the children in the fourth class.
They operationalize the cultural capital as the volume of the books in the parents' house.
They want to find out if there is a significant difference between children whose parents have over 100 books, and children whose parents have a maximum of one hundred books.

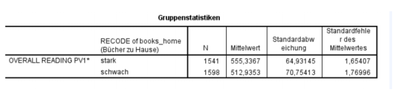
A table of statistic is given:
View attachment 6403

where Mittelwert=mean value, Standardabweichung=standard deviation, Standardfehler des Mittelswertes=standard error of mean value. We have to compute a T-Test to find out, if we can confirm out hypothesis and to get a statistic significant relation.
First we have to prove with a F-Test, if we have to apply a double T-Test or a Test of Welch.
At the F-Test and the T-Test we have a significance level of 5 %. How can we check what T-Test we have to apply? (Wondering)

The null hypothesis is that when the parents have more than 100 books then the children are better in reading than others, or not?

Do we get from that that we don't need a double T-Test? (Wondering)
Also using the F-Test how can we check if there is an homogeneity or a heterogeneity of variance? Do we have to use this formula ? (Wondering)
 

Attachments

  • statistic.PNG
    statistic.PNG
    10.3 KB · Views: 56
Last edited by a moderator:
Physics news on Phys.org
  • #2
Hey mathmari! (Smile)

Either way, we're going to do an independent 2-sample t-test.
The only question is how we're going to calculate the standard error SE.
That depends on whether we should assume equal variances (double t-test) or unequal variances (Welch's test).
To figure that out we'll do an F-test, for which we need to calculate the F-score:
$$F=\frac{s_1^2}{s_2^2}$$
We'll have to e.g look up in an F-table what the critical F-score is. (Thinking)EDIT: Oh, and the null hypothesis is (always): there is no difference, everything behaves as if there is nothing special. (Nerd)
 
  • #3
We have this table. I haven't really understood at which column and row we have to look? Could you explain it to me? (Wondering)
 
Last edited by a moderator:
  • #4
mathmari said:
We have this http://mathhelpboards.com/advanced-probability-statistics-19/tests-20752.html#post94306. I haven't really understood at which column and row we have to look? Could you explain it to me? (Wondering)

That link links to this page... (Worried)

Anyway, the procedure how to do the F-test for equality of variances is explained here in wiki.
 
  • #5
I corrected the link. It holds that the variance is the square of the given standard deviation.

So, $s_1^2=64.93145$ and $s_2^2=70.75413$. Then $F=\frac{s_1^2}{s_2^2}=\frac{64.93145}{70.75413}\approx 0.9177$.

Is this correct? (Wondering)
 
  • #6
mathmari said:
I corrected the link. It holds that the variance is the square of the given standard deviation.

So, $s_1^2=64.93145$ and $s_2^2=70.75413$. Then $F=\frac{s_1^2}{s_2^2}=\frac{64.93145}{70.75413}\approx 0.9177$.

Is this correct? (Wondering)

Yes... although it seems we didn't actually square those values... (Worried)

That table is a bit awkward. It doesn't show sufficient degrees of freedom on the x-axis (sample size of the first group minus 1).
Do we have another table? (Wondering)
 
  • #7
I like Serena said:
Yes... although it seems we didn't actually square those values... (Worried)

That table is a bit awkward. It doesn't show sufficient degrees of freedom on the x-axis (sample size of the first group minus 1).
Do we have another table? (Wondering)
$$F=\frac{s_1^2}{s_2^2}=\frac{64.93145^2}{70.75413^2}\approx 0.84218$$ right? (Wondering)

I still haven't understood how to use the table? (Worried)
 
Last edited by a moderator:
  • #8
mathmari said:
$$F=\frac{s_1^2}{s_2^2}=\frac{64.93145^2}{70.75413^2}=\approx 0.84218$$ right? (Wondering)

I still haven't understood how to use the table? (Worried)

Right.

The degrees of freedom are respectively $DF_1 = n_1 -1 = 1541 - 1$ ($x$-axis) and $DF_2 = n_2 - 1= 1598 - 1$ ($y$-axis).
The first table is for the threshold of significance $\alpha=0.05$, which is what we will want.
When we look it up, we find the critical F-value $F^*$. (Nerd)

If $F > F^*$ or $F < \frac{1}{F^*}$, then the variances are significantly different.
Otherwise they are assumed to be equal.
Note that an $F$-value of $1$ means that the variances are exactly the same.

What is the closest $F^*$ value that we can find?
What can we say about on which side of $F^*$ our $F$-value will be? (Wondering)
 
  • #9
I like Serena said:
The degrees of freedom are respectively $DF_1 = n_1 -1 = 1541 - 1$ ($x$-axis) and $DF_2 = n_2 - 1= 1598 - 1$ ($y$-axis).

At a nect question it is asked to compute the degrees of freedom and the choices are:
a) 3137
b) 3129
c) 3345

(Wondering)
I like Serena said:
The first table is for the threshold of significance $\alpha=0.05$, which is what we will want.
When we look it up, we find the critical F-value $F^*$. (Nerd)

If $F > F^*$ or $F < \frac{1}{F^*}$, then the variances are significantly different.
Otherwise they are assumed to be equal.
Note that an $F$-value of $1$ means that the variances are exactly the same.

What is the closest $F^*$ value that we can find?
What can we say about on which side of $F^*$ our $F$-value will be? (Wondering)

We have that $\frac{1}{0.84218}\approx 1.19$ but at the table the smallest number is $1.93$. What do we do now? (Wondering)
 
  • #10
mathmari said:
At a nect question it is asked to compute the degrees of freedom and the choices are:
a) 3137
b) 3129
c) 3345

(Wondering)

That looks as if it's about the degrees of freedom for the t-test we're going to do.
And that depends on whether we're going to do the t-test with equal variances assumed (double t-test) or the t-test with unequal variances assumed (Welch's t-test).
Do we have the formulas for the degrees of freedom in either case? (Wondering)

mathmari said:
We have that $\frac{1}{0.84218}\approx 1.19$ but at the table the smallest number is $1.93$. What do we do now? (Wondering)

We find another F-table, since we cannot be quite sure yet whether it is significant or not (although it doesn't look significant)...
Can we find one? (Thinking)
 
  • #11
I like Serena said:
We find another F-table, since we cannot be quite sure yet whether it is significant or not (although it doesn't look significant)...
Can we find one? (Thinking)
At this https://www.ma.utexas.edu/users/davis/375/popecol/tables/f005.html there is 1.19.
 
  • #12
mathmari said:
At this https://www.ma.utexas.edu/users/davis/375/popecol/tables/f005.html there is 1.19.

Hmm... that table gives $F^*=1.03$ for $\alpha=0.05$, $DF_1 > 1000$, and $DF_2 > 1000$.
And we had $F=1.19$, so that implies we need to assume unequal variances... (Thinking)
 
  • #15
I like Serena said:
We need another section on that same page where it says unequal variances... (Thinking)

Oh yes...

We have taht \begin{equation*}t=\frac{\overline{X}_1-\overline{X}_2}{s_{\overline{\Delta}}}\end{equation*} where $\sigma_{\Delta}=\sqrt{\frac{s_1^2}{N_1}+\frac{s_2^2}{N_2}}$.

We have that \begin{equation*}\sigma_{\Delta}=\sqrt{\frac{s_1^2}{N_1}+\frac{s_2^2}{N_2}}=\sqrt{\frac{64.93145^2}{1541}+\frac{70.75413^2}{1598}}= 2.42\end{equation*}

Thereofre we get \begin{equation*}t=\frac{555.3367-512.9353}{2.42}=17.52\end{equation*} right? (Wondering)
 
Last edited by a moderator:
  • #16
That looks correct yes. (Nod)
 
  • #17
I like Serena said:
That looks correct yes. (Nod)

Great! Thank you very much! (Happy)
 

Related to Investigating Reading Comp. w/ Cultural Capital: A T-Test

1. What is the purpose of conducting a T-test in this study?

The purpose of conducting a T-test in this study is to determine if there is a significant difference in reading comprehension scores between two groups with different levels of cultural capital.

2. How is cultural capital measured in this study?

Cultural capital is measured using a questionnaire that assesses an individual's exposure to and knowledge of cultural resources such as literature, art, and music.

3. What is the sample size for this study?

The sample size for this study is the total number of participants, which is typically at least 30 individuals per group to ensure statistical power and reliability.

4. Is cultural capital the only factor that influences reading comprehension?

No, there may be other factors such as socioeconomic status, education level, and learning disabilities that can also impact reading comprehension scores.

5. What are the potential implications of this study?

The potential implications of this study are to shed light on the importance of cultural capital in relation to reading comprehension and to potentially inform educational interventions and policies that aim to improve reading skills and reduce achievement gaps among individuals with different levels of cultural capital.

Similar threads

  • Set Theory, Logic, Probability, Statistics
Replies
20
Views
3K
  • Set Theory, Logic, Probability, Statistics
Replies
26
Views
3K
  • Set Theory, Logic, Probability, Statistics
Replies
8
Views
2K
  • Set Theory, Logic, Probability, Statistics
Replies
4
Views
4K
  • Set Theory, Logic, Probability, Statistics
Replies
19
Views
2K
  • Set Theory, Logic, Probability, Statistics
Replies
2
Views
3K
Replies
63
Views
7K
  • Set Theory, Logic, Probability, Statistics
Replies
1
Views
2K
  • Computing and Technology
Replies
1
Views
3K
  • Art, Music, History, and Linguistics
Replies
1
Views
1K
Back
Top