Finding equation from logarithmic graph

In summary, the equation for the line that descends towards zero is y=a*b^x. The equation can be found by using linear equations and plugging in the values for a and b.
  • #1
dsm7272
3
0
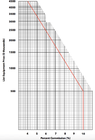
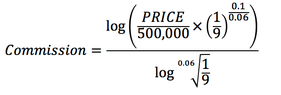
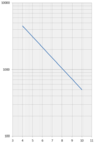
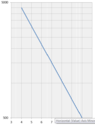
I've spent some time researching and trying to find an equation for this line, but it's not exact. I'm only searching for the equation of the line that descends towards zero (the angled line). I plugged in some numbers and it does not match the graph, the line on the graph is steeper. I start with y=a*b^x, solve for a and b then solve to show what x equals (commission). I followed some log rules and end up with the equation you see below in the image.

Can anyone help me find the equation?View attachment 7643

View attachment 7644
 

Attachments

  • Screen Shot 2017-12-22 at 4.07.13 PM.png
    Screen Shot 2017-12-22 at 4.07.13 PM.png
    47.8 KB · Views: 59
  • Screen Shot 2017-12-22 at 4.12.17 PM.png
    Screen Shot 2017-12-22 at 4.12.17 PM.png
    6.4 KB · Views: 62
Mathematics news on Phys.org
  • #2
It seems you are making this more complicated than it needs to be - the line is straight - so a linear model should be sufficient. Can you find a linear equation that represents the line?
 
  • #3
greg1313 said:
It seems you are making this more complicated than it needs to be - the line is straight - so a linear model should be sufficient. Can you find a linear equation that represents the line?

I think the y-axis is intended to be a logarithmic scale. Is the y-axis number scale wrong? Is that the problem?
The line was placed on some generic log scale graph, then a line was drawn.
 
  • #4
Hi dsm7272,

It's pretty hard (if not impossible) for me to tell what logarithmic scale is being used and I think that information is crucial. Do you have any more information about the graph?
 
  • #5
dsm7272 said:
I think the y-axis is intended to be a logarithmic scale. Is the y-axis number scale wrong? Is that the problem?
The line was placed on some generic log scale graph, then a line was drawn.

Hi dsm7272! Welcome to MHB! (Smile)

If I try to find the slope of the line segment with end points at prices 500 and 4500, I get $\frac{10\%-4\%}{\log(500) - \log(4500)} = -0.0628771$.
And from the formula the slope should be $\dfrac{1}{\log\sqrt[0.06]{\frac 19}} = -0.0628771$.
So that is a match.
 
  • #6
I like Serena said:
Hi dsm7272! Welcome to MHB! (Smile)

If I try to find the slope of the line segment with end points at prices 500 and 4500, I get $\frac{10\%-4\%}{\log(500) - \log(4500)} = -0.0628771$.
And from the formula the slope should be $\dfrac{1}{\log\sqrt[0.06]{\frac 19}} = -0.0628771$.
So that is a match.
Thank you. Are you saying my equation is correct? Because when I go to plug in 1,500 as the price I get 7% commission. But, on the graph it's more like 7.4%. and that's where I'm confused. Maybe the scale of the graph is off?
 
  • #7
dsm7272 said:
Thank you. Are you saying my equation is correct? Because when I go to plug in 1,500 as the price I get 7% commission. But, on the graph it's more like 7.4%. and that's where I'm confused. Maybe the scale of the graph is off?

Indeed!
The numbers have been placed wrong on the graph paper.
The graph should look like:
View attachment 7645

If I'm not mistaken, it could be fixed by putting all prices one line down.
That is, the 500 should be at the bottom. And 5000 should be at the top.
That is:
View attachment 7646
 

Attachments

  • Price_Commission_LogPlot.png
    Price_Commission_LogPlot.png
    3.1 KB · Views: 53
  • Price_Commission_LogPlot2.png
    Price_Commission_LogPlot2.png
    5 KB · Views: 51

Related to Finding equation from logarithmic graph

1. How do I determine the equation from a logarithmic graph?

To find the equation from a logarithmic graph, you will need to identify the base of the logarithmic function. This is typically represented by the subscript on the "log" symbol. Next, determine the coordinates of two points on the graph and use them to create a system of equations. Finally, solve the system of equations to find the values of the coefficients in the logarithmic equation.

2. What is the difference between a logarithmic graph and a linear graph?

A logarithmic graph is a curve that increases or decreases rapidly at first and then begins to level off, while a linear graph is a straight line with a constant slope. In other words, a logarithmic graph represents a relationship where the dependent variable changes exponentially with respect to the independent variable, while a linear graph represents a relationship where the dependent variable changes at a constant rate with respect to the independent variable.

3. Can a logarithmic graph have a negative slope?

Yes, a logarithmic graph can have a negative slope. This occurs when the base of the logarithmic function is between 0 and 1. In this case, the graph will be decreasing from left to right, with the slope becoming steeper as the values on the x-axis increase.

4. How do I know if a graph represents a logarithmic function?

A graph represents a logarithmic function if it has a curve that increases or decreases rapidly at first and then begins to level off. Additionally, the x-axis represents the input variable and the y-axis represents the output variable. The base of the logarithmic function can also be identified by the subscript on the "log" symbol.

5. Can a logarithmic graph have an asymptote?

Yes, a logarithmic graph can have an asymptote. The asymptote is a line that the graph approaches but never touches. In a logarithmic graph, the asymptote is a vertical line that is parallel to the y-axis. The value of the asymptote can be found by setting the input variable equal to 0 and solving for the output variable.

Similar threads

  • Precalculus Mathematics Homework Help
Replies
10
Views
625
Replies
37
Views
3K
Replies
49
Views
1K
  • General Math
Replies
1
Views
1K
Replies
3
Views
1K
Replies
13
Views
2K
Replies
7
Views
2K
Replies
6
Views
2K
  • Introductory Physics Homework Help
Replies
5
Views
793
  • Introductory Physics Homework Help
Replies
6
Views
968
Back
Top