{Edit-Solved} Confirmation requested on deriving functions from graphs

In summary, the graph shows a periodic function with a period of 2##\pi##. The function can be expressed as ##y=\frac{a}{\pi}(x-2n\pi)## for ##0<(x-2n\pi)<\pi## for integer n and ##y=\frac{a}{\pi}x## for ##2n\pi<x<(2n+1)\pi## for integer n. To find the Fourier Series for this function, one can use the formula ##f(x)=\frac{a_0}{2}+\sum_{k=1}^\infty (b_k \sin kx + a_k \cos kx)## and calculate
  • #1
warhammer
151
31
TL;DR Summary
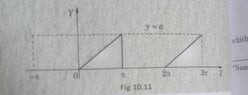
So I basically saw this graph specified as a particular waveform in my book while reading Fourier Series. I decided to try and derive its function since once I do that I can easily find the FS. Please find the photo and my attempt below, just need a small confirmation if I'm right/wrong.
So I thought that the graph tries to tell us that the function is periodic after 2π interval. So I tried to derive its function from the graph as follows using the point slope equation form for the points (0,0) & (a,π): ##y= ({a}/{π})*x##

I hope this function is alright and I just need to find its Fourier Series
 

Attachments

  • IMG_20220313_022657_845.jpg
    IMG_20220313_022657_845.jpg
    21.2 KB · Views: 66
Mathematics news on Phys.org
  • #2
Actually the graph shows
##y=\frac{a}{\pi}(x-2n\pi)## for ##0<(x-2n\pi)<\pi## for integer n
y=0 for others.
 
  • Informative
Likes warhammer
  • #3
anuttarasammyak said:
Actually the graph shows
##y=\frac{a}{\pi}x## for ##2n\pi<x<(2n+1)\pi## for integer n
y=0 for others.
Oh I see. Now I realize how you have represented it an even general manner. Although I am a bit confused now, how should I find FS for the same, I mean I'm confused about the intervalbin which integration for FS will be carried out..
 
  • #4
Because the function, say f(x), has period of 2##\pi##, it is expressed as
[tex]f(x)=\frac{a_0}{2}+\sum_{k=1}^\infty (b_k \sin kx + a_k \cos kx)[/tex]
You may calculate ##a_k## and ##b_k## in a usual way.
 
  • Informative
Likes warhammer
  • #5
anuttarasammyak said:
Because the function, say f(x), has period of 2##\pi##, it is expressed as
[tex]f(x)=\frac{a_0}{2}+\sum_{k=1}^\infty (b_k \sin kx + a_k \cos kx)[/tex]
You may calculate ##a_k## and ##b_k## in a usual way.
Thank you so much! Now I get it🙏🏻
 
  • Like
Likes anuttarasammyak and berkeman

1. What is the process for deriving a function from a graph?

The process for deriving a function from a graph involves identifying key points on the graph, such as intercepts, turning points, and asymptotes. Then, using these points, you can determine the equation of the function by plugging them into the appropriate formula.

2. Can any graph have a corresponding function?

No, not every graph can have a corresponding function. For a graph to have a corresponding function, it must pass the vertical line test, meaning that no vertical line can intersect the graph more than once. If a graph fails this test, it cannot have a corresponding function.

3. How do you find the domain and range of a function from its graph?

To find the domain of a function from its graph, you must look at the x-values of the points on the graph. The domain is the set of all possible x-values that the function can take on. Similarly, to find the range, you must look at the y-values of the points on the graph. The range is the set of all possible y-values that the function can take on.

4. Can a function have more than one graph?

No, a function can only have one graph. This is because a function is defined as a set of ordered pairs where each input (x-value) is paired with exactly one output (y-value). If a function had more than one graph, it would mean that one input has multiple outputs, which violates the definition of a function.

5. How can I use a graph to solve a function?

A graph can be used to solve a function by identifying the x-value of the point where the function intersects with a given y-value. This x-value can then be substituted into the function to find the corresponding y-value. Additionally, a graph can also be used to identify the behavior of a function, such as its increasing or decreasing intervals, maximum and minimum points, and asymptotes.

Similar threads

  • General Math
Replies
9
Views
2K
Replies
1
Views
1K
Replies
23
Views
4K
  • General Math
Replies
8
Views
1K
Replies
4
Views
420
Replies
12
Views
2K
Replies
2
Views
3K
  • Precalculus Mathematics Homework Help
Replies
17
Views
2K
  • Introductory Physics Homework Help
Replies
5
Views
779
Replies
2
Views
838
Back
Top