Sets and Venn Diagrams for Real Numbers: Understanding Associative Axioms

In summary: I don't have time to do that right now. But I can tell you that the proof is very similar to the one given here.
  • #1
bergausstein
191
0
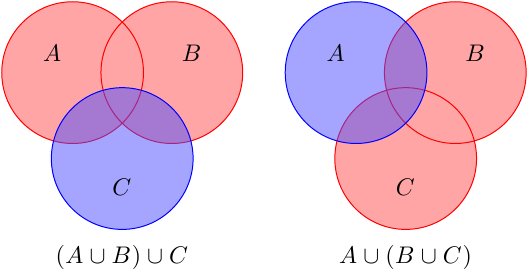
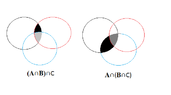
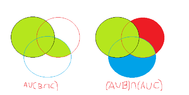
the associative axioms for the real numbers correspond to the following statements about sets: for any sets A, B, and C, we have $(A\cup B)\cup C=A\cup (B\cup C)$ and $(A\cap B)\cap C=A\cap (B\cap C)$. Illustrate each of these statements using Venn diagrams.

can you show me how to draw the first one with the union of the sets, after that I'll try to illustrate the second statement. just want to get an idea how to go about it.thanks!
 
Physics news on Phys.org
  • #2
The task to "illustrate" is not really mathematical. It basically says, "Draw a picture that you believe would be helpful for grasping associativity of set union". But what people believe to be helpful or relevant may differ.

I would draw it like this.

venn3.png


The idea is that red union is done first and then one adds the blue set. In the end we are interested in the colored region, which is the same in both cases.
 
  • #3
this is what i tried for the associativity of intersection.

the black circle is A, the red one is B and the blue one is C.

View attachment 1151
 

Attachments

  • venn 2.1.png
    venn 2.1.png
    3.2 KB · Views: 60
  • #4
Follow up question. can we also illustrate the distributive law of intersection over union? and union over intersection? how would that look like?
 
  • #5
yes we can.

A = BLACK
B = RED
C = BLUE
for the intersection over union i would illustrate it like this
View attachment 1152

hope this would help you illustrate the other one. :)
 

Attachments

  • Venn2.4.png
    Venn2.4.png
    4.6 KB · Views: 68
  • #6

Attachments

  • Venn2.5.png
    Venn2.5.png
    3.7 KB · Views: 60
  • #7
bergausstein said:
this is what i tried for the associativity of intersection.

the black circle is A, the red one is B and the blue one is C.

View attachment 1151
Good job!

- - - Updated - - -

bergausstein said:
here's my try.

View attachment 1154

is this correct?
To me this is okay. But as Evgeny.Makarov pointed out this might not be okay to someone else. Cuz he might say that 'no this does not illustrate the identity correctly' and no one can do anything about it. Don't give it too much importance. Just be sure to understand why $A\cup(B\cap C)=(A\cup B)\cap (A\cup C)$ is true. Can you show this without a diagram?
 
  • #8
let say $A=\{1,2,3\}$, $B=\{4,5,6\}$, $C=\{6,7,8\}$

$A\cup (B\cap C)=(A\cup B)\cap (A\cup C)$

$\{1,2,3\}\cup \{6\}=\{1,2,3,4,5,6\}\cap \{1,2,3,4,6,7,8\}$
$\{1,2,3,6\}=\{1,2,3,6\}$

but i know there's a more general way to show why that is true. can you show me your work? thanks! I'm weak when it comes to generalizing.
 
  • #9
bergausstein said:
let say $A=\{1,2,3\}$, $B=\{4,5,6\}$, $C=\{6,7,8\}$

$A\cup (B\cap C)=(A\cup B)\cap (A\cup C)$

$\{1,2,3\}\cup \{6\}=\{1,2,3,4,5,6\}\cap \{1,2,3,4,6,7,8\}$
$\{1,2,3,6\}=\{1,2,3,6\}$

but i know there's a more general way to show why that is true. can you show me your work? thanks! I'm weak when it comes to generalizing.
The general way of showing that $X=Y$ is to show that $X\subseteq Y$ and $Y\subseteq X$.

Here $X=A\cup(B\cap C)$ and $Y=(A\cap B)\cap (A\cup C)$. Let $x\in X$. Can you show that $x$ is in $Y$ too?
 
  • #10
if $X\subseteq Y$ and $Y\subseteq X$ it follows that $X=Y$ and we may conclude that X and Y have precisely the same elements. we can now say that $x\in Y$ given that $x\in X$.
am i right?

and for educational purposes can anybody show me your complete work for proving the statement $A\cup(B\cap C)=(A\cup B)\cap (A\cup C)$

thanks! :)
 

Related to Sets and Venn Diagrams for Real Numbers: Understanding Associative Axioms

1. What is a set?

A set is a collection of objects or elements that share a common characteristic or property. The objects or elements in a set can be anything from numbers and letters to people and animals.

2. What is a Venn diagram?

A Venn diagram is a graphical representation of sets using circles or other shapes that overlap to show the relationships between the sets. It is commonly used to compare and contrast different groups of objects or elements.

3. How do you read a Venn diagram?

In a Venn diagram, each circle represents a set, and the overlapping areas represent the elements that are common to both sets. The area outside of all the circles represents elements that are not included in any of the sets.

4. What is the purpose of using Venn diagrams?

Venn diagrams are useful for visualizing and understanding the relationships and similarities between different sets. They can also be used for problem-solving and decision-making in fields such as mathematics, statistics, and logic.

5. How do you create a Venn diagram?

To create a Venn diagram, start by drawing two or more overlapping circles or other shapes. Then, label each circle with the name of a set and write the elements or objects that belong to each set inside the corresponding circle. Finally, add any elements that are common to multiple sets in the overlapping areas.

Similar threads

  • Set Theory, Logic, Probability, Statistics
Replies
2
Views
1K
  • Set Theory, Logic, Probability, Statistics
Replies
12
Views
5K
  • Set Theory, Logic, Probability, Statistics
Replies
11
Views
3K
  • Set Theory, Logic, Probability, Statistics
Replies
10
Views
2K
  • Set Theory, Logic, Probability, Statistics
Replies
4
Views
2K
  • Set Theory, Logic, Probability, Statistics
Replies
1
Views
1K
  • Set Theory, Logic, Probability, Statistics
Replies
2
Views
2K
  • Set Theory, Logic, Probability, Statistics
Replies
10
Views
2K
  • Set Theory, Logic, Probability, Statistics
Replies
4
Views
2K
  • Set Theory, Logic, Probability, Statistics
Replies
3
Views
1K
Back
Top