How Tall Are Indonesians Compared to Dutchmen?

In summary, according to the data, the average tallest men live in Netherlands and Montenegro, while the average shortest men live in Indonesia. The height of a giant of Indonesia is exactly 2 standard deviations over the average height of an Indonesian, and he goes to Netherlands.
  • #1
mathmari
Gold Member
MHB
5,049
7
Hey! :eek:

I am looking at the following:

The average tallest men live in Netherlands and Montenegro mit $1.83$m=$183$cm.
The average shortest men live in Indonesia mit $1.58$m=$158$cm.
The standard deviation of the height in Netherlands/Montenegro is $9.7$cm and in Indonesia it is $7.8$cm.

The height of a giant of Indonesia is exactly 2 standard deviations over the average height of an Indonesian. He goes to Netherlands. Which is the part of the Netherlands that are taller than that giant?

I thought to do the following:

Since the height of a giant of Indonesia is exactly 2 standard deviations over the average height of an Indonesian, we get that his height is $158+2\cdot 7.8=173.6$cm, right?

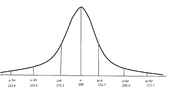
We have the following:
View attachment 6314

Now we want to compute $P(x>173.6)=1-P(x\leq 173.6)$, right? (Wondering)
At the graph we have $173.3$ how could we compute the $P(x\leq 173.6)$ ? (Wondering)
 

Attachments

  • height.png
    height.png
    5.3 KB · Views: 65
Physics news on Phys.org
  • #2
Hi mathmari,

I'm still waking up so forgive any errors in thought.

Your logic looks sound to me. The height of the giant from Indonesia is 173.6, and the question is what percent of the population in the Netherlands is taller than this?

So from here it just depends on the method you're expected to use. I work with statistics quite a bit and a program like R or even Wolfram Alpha will easily tell you that probability, but in general there are 4 ways I can think of:

1) Use a software package to output the probability.
2) Use the definition of the normal distribution and approximate this area by approximating an integral.
3) Standardize this distribution to a Normal(0,1) distribution, then look up the value in a table (very old method).
4) Use the fact that 2 SD above the mean for Indonesia is very close to one SD below the the mean for the Netherlands ($183-9.7 = 173.3$). If we use this as approximately 173.6 then we can use the empirical rule to estimate the probability.

It all depends on the expectation of the question. Which method do you think is most appropriate? In practice, (1) is definitely what we would do.
 
  • #3
Jameson said:
Hi mathmari,

I'm still waking up so forgive any errors in thought.

Your logic looks sound to me. The height of the giant from Indonesia is 173.6, and the question is what percent of the population in the Netherlands is taller than this?

So from here it just depends on the method you're expected to use. I work with statistics quite a bit and a program like R or even Wolfram Alpha will easily tell you that probability, but in general there are 4 ways I can think of:

1) Use a software package to output the probability.
2) Use the definition of the normal distribution and approximate this area by approximating an integral.
3) Standardize this distribution to a Normal(0,1) distribution, then look up the value in a table (very old method).
4) Use the fact that 2 SD above the mean for Indonesia is very close to one SD below the the mean for the Netherlands ($183-9.7 = 173.3$). If we use this as approximately 173.6 then we can use the empirical rule to estimate the probability.

It all depends on the expectation of the question. Which method do you think is most appropriate? In practice, (1) is definitely what we would do.

Let's use (4):

From the graph we have that $P(x\leq 173.3)=50\%-\frac{68\%}{2}=16\%$, or not? (Wondering)

So, we have that $P(x>173.3)=1-P(x\leq 173.3)=1-0.16=0.84$.

Does this mean that appoximately $84$% of the Netherlands are taller than the giant? (Wondering)
 
  • #4
That looks like a reasonable approximation to me. Again, my apologies if later on today I come back and say otherwise. I'm heading out the door and half asleep.

Here is the exact area from R:
Code:
> 1-pnorm(173.6,183,9.7)
          [1] 0.8337454
 
  • #5
Heh. I'm from the Netherlands.
Almost every man I know, and most women as well, are considered Indonesian giants! ;)
And the men that are not giants typically have origins outside of the Netherlands.
As it is, I'm just shy of being a giant myself. (Doh)
 
  • #6
Ah ok!

Then to be in the Indonesian basketaball team one has to be at the one percent tallest of the country. Which is the minimum height that someone has to have to be in the team?

Let $m$ be the minimal acceptable height, then $P(x\geq m)=0,01$, or not? (Wondering)
But how can we compute $m$, again from the graph of the Indonesian, this time? (Wondering)

Is the Netherlands would have the same minimal height, how many would have height bigger than $m$ ? (Wondering)
 
  • #7
mathmari said:
Ah ok!

Then to be in the Indonesian basketaball team one has to be at the one percent tallest of the country. Which is the minimum height that someone has to have to be in the team?

Let $m$ be the minimal acceptable height, then $P(x\geq m)=0,01$, or not? (Wondering)
But how can we compute $m$, again from the graph of the Indonesian, this time? (Wondering)

Is the Netherlands would have the same minimal height, how many would have height bigger than $m$ ? (Wondering)

Suppose we pick an online calculator or table and look up which z-score corresponds to a cumulative probability of 0.01 (or even better: 0.99)? (Wondering)

That z-score is the number of standard deviations above (or below) the mean that we need.

First hit I get from google is for instance: Normal Distribution Calculator
 
  • #8
I like Serena said:
Suppose we pick an online calculator or table and look up which z-score corresponds to a cumulative probability of 0.01 (or even better: 0.99)? (Wondering)

That z-score is the number of standard deviations above (or below) the mean that we need.

First hit I get from google is for instance: Normal Distribution Calculator

From this calculator we get that $P(x\leq 176.146)=0.99$. That means that $1-P(X>176.146)=0.01$, right? (Wondering)

So, we have to use a calculator in this case, or would be also possible without? (Wondering) For the last question, we want to calculate $P(X>176.146)$ for the Netherlands. Using again that calculator we get $P(X\leq 176.146)=0.23991 \Rightarrow 1-P(X\leq 176.146)=1-0.23991 \Rightarrow P(X>176.146)=0.76009$.

Is this correct? (Wondering)
 
  • #9
Could we maybe show this also using standardized radom variable? (Wondering)
 
  • #10
I have done the following: $$P(X>m)=0,01 \Rightarrow 1-P(X>m)=1-0,01 \Rightarrow P(X\leq m)=0.99 \Rightarrow \Phi \left (\frac{m-158}{7.8}\right )=0.99$$

From the table we get $\frac{m-158}{7.8}=2.32 \Rightarrow m=176.174\ cm$. Is this correct? For the second question: $$P(X>176)=1-P(X\leq 176)=1-\Phi \left (\frac{176-183}{9.7}\right )\cong 1-\Phi (-0.72) \Rightarrow P(X>176)=1-0.23576=0.76424$$ Is this correct?
 
  • #11
Hey mathmari! (Smile)

It seems to me you're asking for confirmation for something you already know.

Oh well, all right, yes, what you're writing is all correct! (Nod)
 
  • #12
I like Serena said:
It seems to me you're asking for confirmation for something you already know.

Oh well, all right, yes, what you're writing is all correct! (Nod)

Thank you! (Mmm)
 

Related to How Tall Are Indonesians Compared to Dutchmen?

What is normal distribution?

Normal distribution is a statistical concept that describes the distribution of a set of data points in a symmetrical bell-shaped curve. It is also known as Gaussian distribution or bell curve.

Why is height often described as having a normal distribution?

Height is often described as having a normal distribution because it follows the characteristics of a normal distribution - it is symmetrical, with most people falling within the average height range and fewer people at the extremes of very tall or very short.

What is the average height for adults?

The average height for adults varies depending on the population and gender. In the United States, the average height for adult males is 5 feet 9 inches (175.3 cm) and for adult females is 5 feet 4 inches (162.6 cm).

Can height be accurately predicted using normal distribution?

While height may follow a normal distribution, it cannot be accurately predicted for an individual using this concept. Other factors such as genetics, nutrition, and environmental factors also play a role in determining an individual's height.

What are the limitations of using normal distribution to describe height?

Normal distribution assumes that the data is normally distributed, which may not always be the case for height. Additionally, height may vary significantly between different populations and is not a fixed or constant measure. Therefore, using normal distribution to describe height may not accurately reflect the true distribution of heights in a given population.

Similar threads

  • Set Theory, Logic, Probability, Statistics
Replies
28
Views
3K
  • Set Theory, Logic, Probability, Statistics
Replies
1
Views
1K
  • Set Theory, Logic, Probability, Statistics
Replies
6
Views
1K
  • Set Theory, Logic, Probability, Statistics
5
Replies
147
Views
7K
  • Biology and Medical
Replies
4
Views
2K
  • Introductory Physics Homework Help
Replies
14
Views
2K
  • Precalculus Mathematics Homework Help
Replies
8
Views
2K
  • Set Theory, Logic, Probability, Statistics
Replies
4
Views
8K
  • Calculus and Beyond Homework Help
Replies
2
Views
8K
  • Set Theory, Logic, Probability, Statistics
Replies
3
Views
2K
Back
Top