Can we determine the symmetry of a distribution without creating a diagram?

In summary, the conversation is about analyzing a list of $300$ data points, representing the square meters of houses. The mean and median values have been calculated and there is a question about the symmetry of the distribution. The use of a histogram to analyze symmetry is suggested, and options for creating one are discussed, including Excel, TikZ, R, and SPSS. The question of how to make a histogram is posed, and the conversation then shifts to creating a frequency distribution table for prices. However, it is noted that there is no information about prices, so the conversation returns to discussing the histogram for square meters and how to check for symmetry with it. The conversation ends with a question about how to create the frequency distribution table.
  • #1
mathmari
Gold Member
MHB
5,049
7
Hey! :eek:

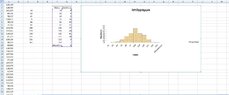
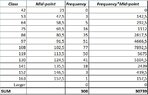
We are given a list of $300$ data which are the square meters of houses. I have calculated the mean value and the median. After that we have to say something about the symmetry of the distribution. For that do we have to make a diagram from the given data? Is there a program to do that? (Wondering)
 
Last edited by a moderator:
Physics news on Phys.org
  • #2
Hey mathmari!

That sounds as if you want to make a histogram of the given data.
Excel can do that for, and so can TikZ.
If you want to go on and apply a statistical test for symmetry, you might consider R (free and online) or SPSS.
They can draw a histogram as well. (Thinking)
 
  • #3
Klaas van Aarsen said:
That sounds as if you want to make a histogram of the given data.
Excel can do that for, and so can TikZ.
If you want to go on and apply a statistical test for symmetry, you might consider R (free and online) or SPSS.
They can draw a histogram as well. (Thinking)

Could you explain to me how I could use Excel or R for that, since I haven't done that before? (Wondering)
 
  • #4
mathmari said:
Could you explain to me how I could use Excel or R for that, since I haven't done that before?

Here is an explanation for Excel.
This page explains it for R. My first hit for "online R" was this one, where I could run the given example. (Thinking)
 
  • #5
Klaas van Aarsen said:
Here is an explanation for Excel.
This page explains it for R. My first hit for "online R" was this one, where I could run the given example. (Thinking)

Ok! I have also an other question. To check the symmetry do we make the histogram from the given data or do we have to order the data first in an increasing order and then make the histogram? (Wondering) If I have applied that correctly, the histogram of the ordered data is this one.

And the histogram of the given data is this one.

By which of these two do we check the symmetry? (Wondering)
 
Last edited by a moderator:
  • #6
mathmari said:
Ok! I have also an other question. To check the symmetry do we make the histogram from the given data or do we have to order the data first in an increasing order and then make the histogram? (Wondering) If I have applied that correctly, the histogram of the ordered data is this one.

And the histogram of the given data is this one.

By which of these two do we check the symmetry?

Those are not histograms. They appear to be plots of the data itself. And indeed they have 300 points. (Worried)
A histogram categorizes the data in bins and makes a bar graph of them.
It means that the data is effectively sorted in those bins, and we should have only 10 or 20 bars or so. (Nerd)

How did you make those graphs? (Wondering)
 
  • #7
Klaas van Aarsen said:
Those are not histograms. They appear to be plots of the data itself. And indeed they have 300 points. (Worried)
A histogram categorizes the data in bins and makes a bar graph of them.
It means that the data is effectively sorted in those bins, and we should have only 10 or 20 bars or so. (Nerd)

The minimum value is 42,075 and the maximum value is 153,574. So the bins could have the interval length $11$ and so we would get the intervalls $42-53$, $53-64$, $64-75$, $75-86$, $86-97$, $97-108$, $108-119$, $119-130$, $130-141$, $141-152$, $152-163$, right? (Wondering)
Klaas van Aarsen said:
How did you make those graphs? (Wondering)

I selected all the $300$ points and then I created the graph (Thinking)
 
  • #8
mathmari said:
The minimum value is 42,075 and the maximum value is 153,574. So the bins could have the interval length $11$ and so we would get the intervalls $42-53$, $53-64$, $64-75$, $75-86$, $86-97$, $97-108$, $108-119$, $119-130$, $130-141$, $141-152$, $152-163$, right?

That is a possible choice for the bins yes. (Thinking)

mathmari said:
I selected all the $300$ points and then I created the graph

I guess you created a general bar graph instead of an actual histogram. (Worried)
 
  • #9
Klaas van Aarsen said:
That is a possible choice for the bins yes. (Thinking)

I got the following:

View attachment 9446

That means that the distribution is symmetric, or not? (Wondering)
Klaas van Aarsen said:
I guess you created a general bar graph instead of an actual histogram. (Worried)

Ahh ok!
 

Attachments

  • histogram.JPG
    histogram.JPG
    114.7 KB · Views: 58
  • #10
mathmari said:
I got the following:

That means that the distribution is symmetric, or not?

Yep. All correct. (Nod)
 
  • #11
Klaas van Aarsen said:
Yep. All correct. (Nod)

Great! (Happy) At the next question we have to create the frequency distribution of the prices for sale. The given data is the square meters of the houses for sale, how can we get the frequency distribution of the prices? I got stuck right now. Isn't some information missing? (Wondering)
 
  • #12
mathmari said:
At the next question we have to create the frequency distribution of the prices for sale. The given data is the square meters of the houses for sale, how can we get the frequency distribution of the prices? I got stuck right now. Isn't some information missing?

If we only have data about the square meters, we can only make a histogram of those.
Perhaps that is intended? (Wondering)
Prices are correlated to square meters after all.
Still, without price information, we can indeed not say anything about prices.
 
  • #13
Klaas van Aarsen said:
If we only have data about the square meters, we can only make a histogram of those.
Perhaps that is intended? (Wondering)
Prices are correlated to square meters after all.
Still, without price information, we can indeed not say anything about prices.

If the histogram of the square meters is intented, then did we have to check the symmetry in an other way, since for the histogram is asked in the next question? (Wondering)
 
  • #14
mathmari said:
If the histogram of the square meters is intented, then did we have to check the symmetry in an other way, since for the histogram is asked in the next question? (Wondering)

A histogram is the bar graph of a frequency distribution table.
So first we make the table and then we create the graph. (Thinking)
 
  • #15
Klaas van Aarsen said:
A histogram is the bar graph of a frequency distribution table.
So first we make the table and then we create the graph. (Thinking)

I got stuck now. How do we create the frequency distribution table? (Wondering)
 
  • #16
mathmari said:
I got stuck now. How do we create the frequency distribution table? (Wondering)

Take a look at your previous histogram. Doesn't it have a table on the left? A table with columns titled Class and Frequency? (Wondering)
That is the frequency distribution table. (Emo)
 
  • #17
Klaas van Aarsen said:
Take a look at your previous histogram. Doesn't it have a table on the left? A table with columns titled Class and Frequency? (Wondering)
That is the frequency distribution table. (Emo)

Ahh so we get this table also automatically from Excel.

I have a question. At the intervals is it correct that the upper bound of the one is equal to the lower bound of the next interval or should it be the next number? (Wondering)
 
  • #18
mathmari said:
I have a question. At the intervals is it correct that the upper bound of the one is equal to the lower bound of the next interval or should it be the next number?

If the next interval starts at the next number, doesn't that mean we have 'gaps' between the intervals?
Whatever we do, there must not be gaps! :eek:

The classes must cover all possible values. And yes, that means there is some ambiguity at the boundaries.
Different conventions are used here.

If we are talking about integers, it is quite common that upper bounds are 1 less than the next lower bound.
This also happens with age groups.
So we might have for instance age groups 18-24, 25-29, 30-34. Note that in this case age 24 also covers people that are 1 day before their 25th birthday. (Nerd)

If we are talking about real numbers, the lower boundaries must be equal to the upper boundaries, since otherwise there would be gaps.
Of course we have a problem now with a number that is exactly on a boundary. Which interval should it belong to? (Wondering)
Then we need to make a consistent choice to either put the number either in the interval below, or the interval above.
The classes are then for instance [1.1, 2.2), [2.2, 3.3), [3.3, 4.4), [4.4, 5.5].
This is more explicit than writing 1.1-2.2, 2.2-3.3, 3.3-4.4, 4.4-5.5, which does not address the ambiguity.
Note that different programs use different conventions.
Excel identifies each class with the upper bound of the corresponding interval, and additionally introduces the extra class 'Larger'.
So with bins 1.1, 2.2, 3.3, 4.4, 5.5, we get the classes ($-\infty$, 1.1], (1.1, 2.2], (2.2, 3.3], (3.3, 4.4], (4.4, 5.5], Larger. (Nerd)

Btw, if we are talking about continuous probability distributions, the chance that a value is exactly on a boundary is supposedly infinitely small (up to machine precision), so there should be no need to worry about it too much. (Whew)
 
  • #19
I got it!

At the next question we have to estimate the the mean value and the median from the data of frequency distribution.

We get the following, don't we?

View attachment 9450

The first mid-point is $(0+42)/2=21$, or not? And we cannot calculate the median of the class Larger, can we?

Therefore the mean value is $\frac{30739}{300}=102.463$. At the beginning of the exercise I calculated the mean value of the square meters to be $102.307$. So the estimated mean value $102.463$ is closed to it, right? (Wondering) For the estimated median do we use the formula $$\text{lower boundary of group of median}+\frac{\frac{\text{total number of values}}{2}-\text{sum of frequencies before median}}{\text{frequency of the median group}}\cdot \text{group width}$$ ? (Wondering)
 

Attachments

  • mean_v.JPG
    mean_v.JPG
    30.2 KB · Views: 45
  • #20
mathmari said:
I got it!

At the next question we have to estimate the the mean value and the median from the data of frequency distribution.

We get the following, don't we?
The first mid-point is $(0+42)/2=21$, or not?

We have a fixed bin size of 11, don't we?
Shouldn't we pick the first mid-point then at $42 - \frac{11}2 = 36.5$ for consistency? (Wondering)
It doesn't really matter though, since the corresponding frequency is 0. So it doesn't contribute to the calculation of the median. Good.

mathmari said:
And we cannot calculate the median of the class Larger, can we?

We might calculate its midpoint by using the fixed bin size of 11 again.
There is no need though, as this bin should be empty. And it is. (Whew)

mathmari said:
Therefore the mean value is $\frac{30739}{300}=102.463$. At the beginning of the exercise I calculated the mean value of the square meters to be $102.307$. So the estimated mean value $102.463$ is close to it, right?

Yep. (Nod)

mathmari said:
For the estimated median do we use the formula $$\text{lower boundary of group of median}+\frac{\frac{\text{total number of values}}{2}-\text{sum of frequencies before median}}{\text{frequency of the median group}}\cdot \text{group width}$$ ?

That looks correct to me yes.
We can compare it with the real median, which is the average of the 2 values in the middle after sorting. (Thinking)
 
  • #21
Klaas van Aarsen said:
That looks correct to me yes.

So, for that formula do we need to know the real median? Or do we assume in which interval the median will be? (Wondering)
 
Last edited by a moderator:
  • #22
mathmari said:
So, for that formula do we need to know the real median? Or do we assume in which interval the median will be?

Can't we find the interval with the median uniquely? (Wondering)

Suppose we add a column with the partial sums of the frequencies that came before.
Then the median is in the interval where that partial sum grows beyond $\frac{\text{total number of values}}{2}$ or $50\%$, isn't it? (Thinking)
The $\text{sum of frequencies before the median}$ is that partial sum before we cross $\frac{\text{total number of values}}{2}$.
 
  • #23
Klaas van Aarsen said:
Can't we find the interval with the median uniquely? (Wondering)

Suppose we add a column with the partial sums of the frequencies that came before.
Then the median is in the interval where that partial sum grows beyond $\frac{\text{total number of values}}{2}$ or $50\%$, isn't it? (Thinking)
The $\text{sum of frequencies before the median}$ is that partial sum before we cross $\frac{\text{total number of values}}{2}$.

Ahh ok! Thank you very much for your help! (Sun)
 

Related to Can we determine the symmetry of a distribution without creating a diagram?

1. How can we determine the symmetry of a distribution without creating a diagram?

There are several methods for determining the symmetry of a distribution without creating a diagram. One approach is to calculate the mean, median, and mode of the data. If these three measures are equal, the distribution is symmetrical. Another method is to use the skewness and kurtosis statistics. A symmetrical distribution will have a skewness of 0 and a kurtosis of 3.

2. Can we determine the symmetry of a distribution by looking at the shape of the data?

Yes, the shape of the data can provide clues about the symmetry of the distribution. For example, if the data is evenly distributed around the mean, it is likely symmetrical. However, it is important to note that the shape of the data alone is not enough to accurately determine the symmetry of a distribution.

3. Is it necessary to create a diagram to determine the symmetry of a distribution?

No, it is not necessary to create a diagram to determine the symmetry of a distribution. As mentioned before, there are other methods such as calculating measures of central tendency and using skewness and kurtosis statistics that can be used to determine symmetry without a diagram.

4. How does the symmetry of a distribution affect statistical analyses?

The symmetry of a distribution can impact the validity and accuracy of statistical analyses. In general, symmetrical distributions are easier to work with and allow for more accurate predictions and inferences. Asymmetrical distributions may require more advanced statistical techniques and can result in less reliable conclusions.

5. Can the symmetry of a distribution change over time?

Yes, the symmetry of a distribution can change over time. This can happen if the underlying factors influencing the data change, or if the sample size or composition changes. It is important to regularly assess the symmetry of a distribution to ensure the accuracy of statistical analyses.

Similar threads

  • Set Theory, Logic, Probability, Statistics
Replies
28
Views
3K
  • Set Theory, Logic, Probability, Statistics
Replies
2
Views
826
  • Set Theory, Logic, Probability, Statistics
Replies
8
Views
705
  • Set Theory, Logic, Probability, Statistics
Replies
4
Views
893
  • Set Theory, Logic, Probability, Statistics
Replies
1
Views
725
  • Set Theory, Logic, Probability, Statistics
Replies
17
Views
881
  • Set Theory, Logic, Probability, Statistics
Replies
1
Views
986
  • Set Theory, Logic, Probability, Statistics
Replies
4
Views
1K
  • Set Theory, Logic, Probability, Statistics
Replies
5
Views
1K
  • Set Theory, Logic, Probability, Statistics
Replies
2
Views
979
Back
Top